
HIV infection in Australia is characterised by a concentrated epidemic, defined as a prevalence of greater than 5% in subpopulations. The prevalence of HIV infection has remained low in the general population, and was estimated to be 0.1% in 2017.[1] This rate is comparable with New Zealand and the Philippines, but lower than other countries in the region, including Thailand (0.1.10%), Papua New Guinea (0.90%) and Cambodia (0.50%)[1] To the end of 2017, a total of 38,172 cases of HIV infection had been diagnosed in Australia (Figure 1), with an estimated 27,545 (24,141 – 31,126) people living with HIV in 2013.[1]
Over the last 5 years, the annual number of cases of newly diagnosed HIV infection has decreased by 7%, dropping below 1000 annual notifications in 2017: (Table 1, Figure 1), with the majority of diagnoses in males (90%).[32] The last 5 years have seen a continued increase in diagnoses from 1,069 in 2009 to 1,236 in 2013.[33] Alongside behaviour changes, the frequency of HIV testing has increased in many settings in the past 5 years, and increased testing can lead to increased diagnoses.[34] The median age of diagnosis for males has remained steady at around 37 years. Women have been diagnosed at a slightly younger age, with a median age at diagnosis of 33 years. Over a third (39%) of diagnoses have been classified as late and 19% as advanced. Of all new diagnoses in this period, 15% (840) were previously diagnosed overseas. There have been very few vertical HIV transmissions from mother to child, with five in the last 5 years (1.8% of perinatal exposures).[35][36]
Table 1. Characteristics of cases of newly diagnosed HIV infection in Australia by year, 2013-2017[1]
|
Year of HIV diagnosis |
||||||
|
Characteristic |
2013 |
2014 |
2015 |
2016 |
2017 |
Total1 |
|
Total cases |
1,032 |
1,084 |
1,026 |
1,013 |
963 |
5,118 |
|
Males (%) |
89.5 |
90.2 |
89.3 |
90.1 |
87.9 |
89.6 |
|
Median age (years) |
||||||
|
Male |
37 |
35 |
35 |
34 |
35 |
35 |
|
Female |
34 |
35 |
36 |
34 |
34 |
34 |
|
Late and advanced HIV infection status at HIV diagnosis |
||||||
|
Late HIV diagnosis (%)2 |
31.9 |
28.5 |
28.9 |
32.7 |
35.9 |
31.2 |
|
Advanced HIV diagnosis (%)2 |
18.4 |
16.7 |
15.9 |
19.5 |
22.5 |
18.4 |
|
Median CD4+ T cell count (cells/µL) |
420 |
440 |
440 |
420 |
390 |
430 |
|
State and Territory |
||||||
|
Australian Capital Territory |
21 |
18 |
14 |
13 |
13 |
79 |
|
New South Wales |
355 |
346 |
348 |
317 |
310 |
1,676 |
|
Northern Territory |
13 |
9 |
9 |
23 |
11 |
65 |
|
Queensland |
181 |
246 |
203 |
195 |
185 |
1,010 |
|
South Australia |
58 |
39 |
44 |
42 |
45 |
228 |
|
Tasmania |
11 |
16 |
16 |
19 |
11 |
73 |
|
Victoria |
307 |
302 |
283 |
312 |
310 |
1,514 |
|
Western Australia |
86 |
108 |
109 |
92 |
78 |
473 |
|
HIV exposure category (%)3 |
||||||
|
Men who have sex with men |
65.9 |
70.2 |
68.2 |
70.3 |
63.0 |
67.6 |
|
Men who have sex with men and injecting drug use |
4.3 |
4.6 |
4.8 |
5.0 |
5.5 |
4.8 |
|
Injecting drug use4 |
2.7 |
2.9 |
2.9 |
1.4 |
3.4 |
2.7 |
|
Heterosexual contact |
21.0 |
18.5 |
20.0 |
20.6 |
24.7 |
20.9 |
|
Receipt of blood/tissue |
0.3 |
0.0 |
0.8 |
0.1 |
0.0 |
0.2 |
|
Mother with/at risk of HIV infection |
0.4 |
0.3 |
0.4 |
0.5 |
0.3 |
0.4 |
|
Other/undetermined |
5.4 |
3.5 |
2.9 |
2.1 |
3.0 |
3.4 |
- Not adjusted for multiple reporting.
- Late HIV diagnosis was defined as newly diagnosed HIV infection with a CD4+ T cell count of less than 350/µL, and advanced HIV infection as newly diagnosed infection with a CD4+ T cell count of less than 200/µL.
- The “Other/undetermined” exposure category was excluded from the calculation of the percentage of cases attributed to each HIV exposure category.
- Excludes men who have sex with men
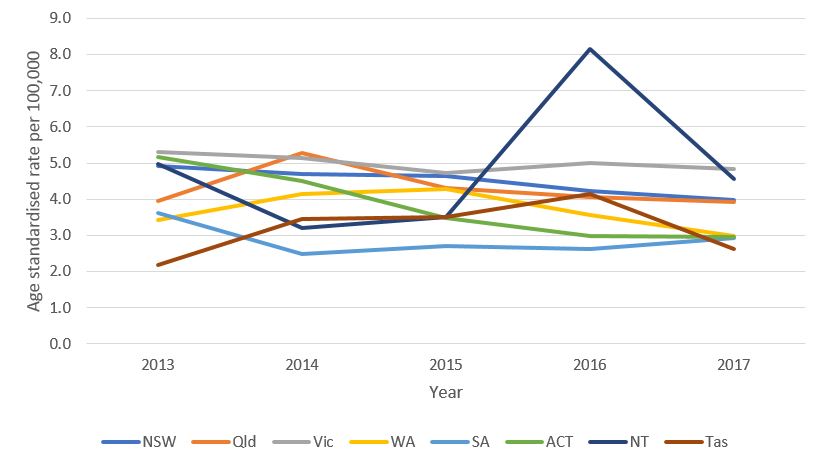
Figure 2. Rates of newly diagnosed HIV infection, 2013-2017, by year and state and territory, Australia